
Visualizing Pipelines
You can visualize your pipelines as graphs to better understand how the components are connected.
Haystack pipelines have draw() and show() methods that enable you to visualize the pipeline as a graph using Mermaid graphs.
Data Privacy Notice
Exercise caution with sensitive data when using pipeline visualization.
This feature is based on Mermaid graphs web service that doesn't have clear terms of data retention or privacy policy.
Prerequisites
To use Mermaid graphs, you must have an internet connection to reach the Mermaid graph renderer at https://mermaid.ink.
Displaying a Graph
Use the Pipeline's show() method to display the diagram in Jupyter notebooks.
my_pipeline.show()
Saving a Graph
Use the Pipeline's draw() method passing the path where you want to save the diagram and the diagram format. Possible formats are: mermaid-text and mermaid-image (default).
my_pipeline.draw(path=local_path)
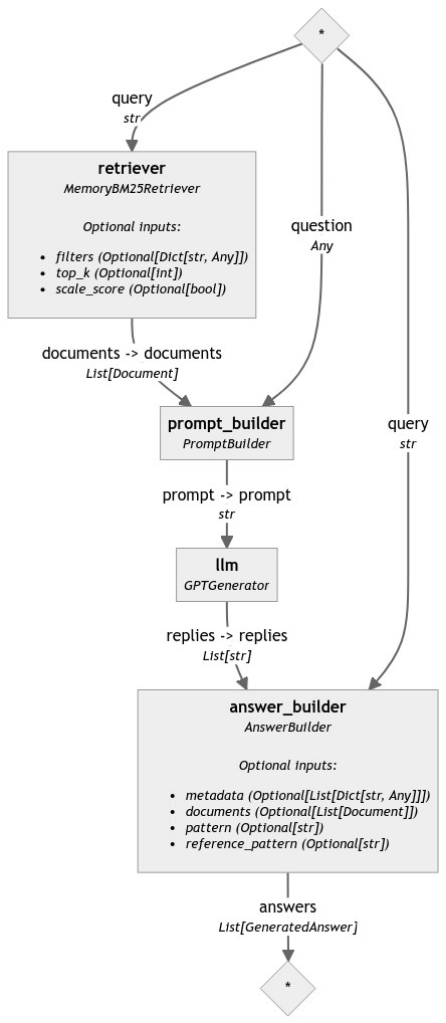
Example
This is an example of what a pipeline graph may look like:
Updated 5 days ago